Currency Internationalization and International Financial Centers: Historical Logic, Evolutionary Mechanisms, and Implications for China (OpenAlex (recherche mondiale))
Summary
- In May 2022, the International Monetary Fund increased the RMB's weight in the Special Drawing Rights basket from 10.92% to 12.28%.p.2
- Between 1865 and 1914, Britain raised £4.1 billion for overseas joint-stock companies as well as foreign and colonial governments.p.4
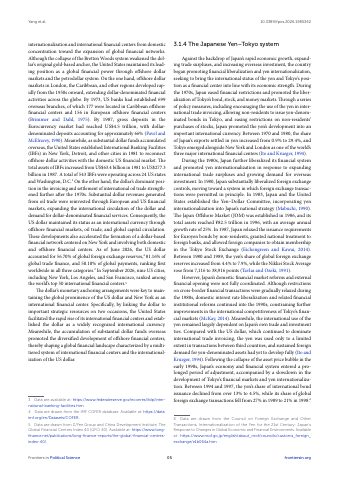
- Gross deposits in the Eurocurrency market reached US$4.5 trillion by 1987, with US dollar-denominated deposits accounting for approximately 66%.p.5
- Between 1970 and 1980, the share of Japan's exports settled in Japanese yen increased from 0.9% to 29.4%.p.5
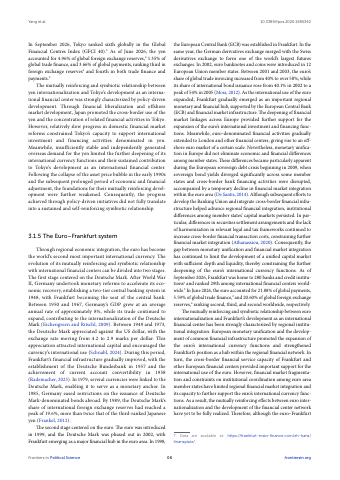
- The euro's share of international bond issuance grew from 40.1% in 2002 to a peak of 54% in 2005.p.6
- Cross-border RMB receipts and payments for securities investment reached RMB 23.6 trillion in 2022.p.10
- In August 2026, Hong Kong accounted for 75.94% of global offshore RMB payment activity.p.11
Key insights
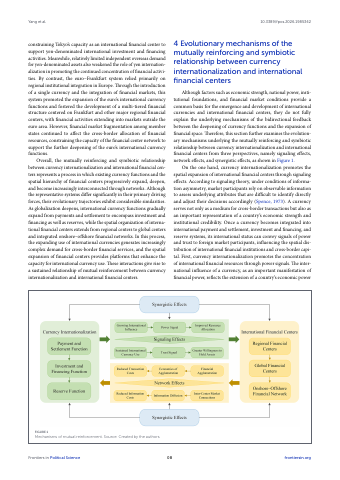
- The co-evolution of currency internationalization and international financial centers is driven by signaling effects, network effects, and synergistic effects.p.1
- Between 1713 and 1763, the average annual issuance of foreign bonds in Amsterdam reached 4 million florins.p.4
- Total assets of US International Banking Facilities increased from US$63.4 billion in 1981 to US$277.3 billion in 1987.p.5
- Total assets of the Japan Offshore Market reached ¥82.5 trillion in 1996, representing an average annual growth rate of 25%.p.5
- As of June 2026, the Japanese yen accounted for 4.96% of global foreign exchange reserves and 3.66% of global payments.p.6
- Between 2001 and 2003, the euro's share of global trade invoicing expanded from 40% to over 50%.p.6
- Currency internationalization conveys power and trust signals that encourage international financial institutions to expand operations in key financial hubs.p.9
- Cross-border RMB receipts and payments between mainland China and Hong Kong accounted for 50.3% of China's total cross-border RMB transactions in 2022.p.10
Pages
 p.1
 p.2
 p.3
 p.4
 p.5
 p.6
 p.7
 p.8
 p.9
 p.10
 p.11
 p.12
 p.13
 p.14
Topics and entities
Summary and figures generated from the document and checked automatically: every number shown appears on the cited page. Publishers can request removal.