2023 National Survey of Unbanked and Underbanked Households (FDIC)
Summary
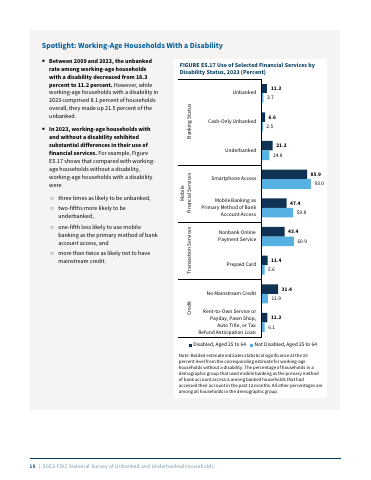
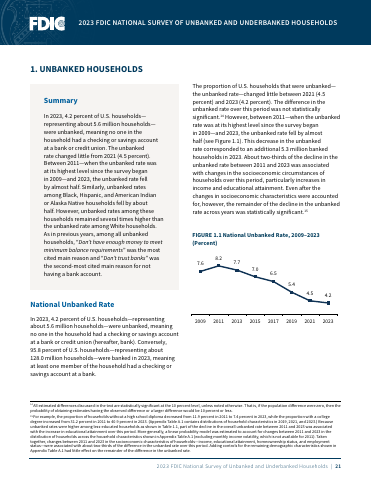
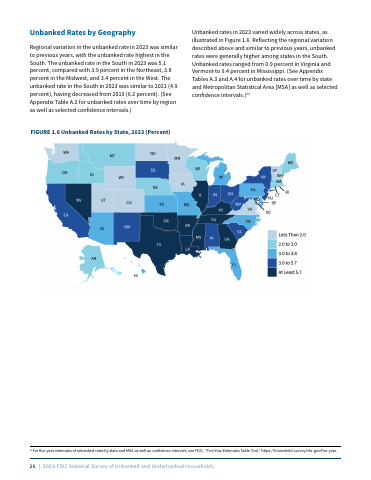
- In 2023, 4.2 percent of U.S. households, representing about 5.6 million households, were unbanked.p.13
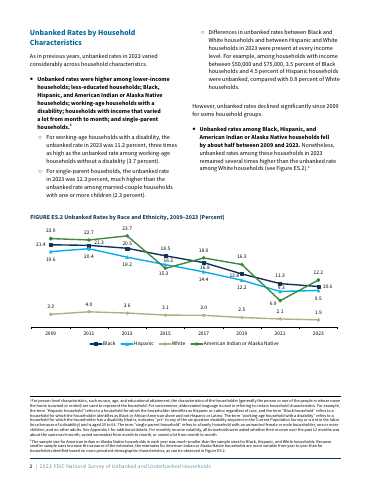
- Between 2011 and 2023, the national unbanked rate fell by almost half, corresponding to an additional 5.3 million banked households.p.13
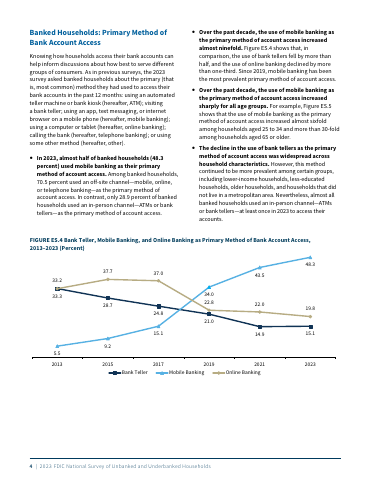
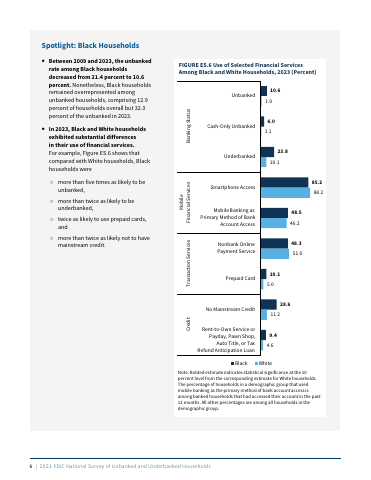
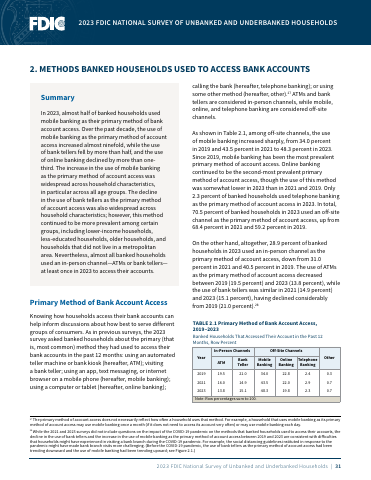
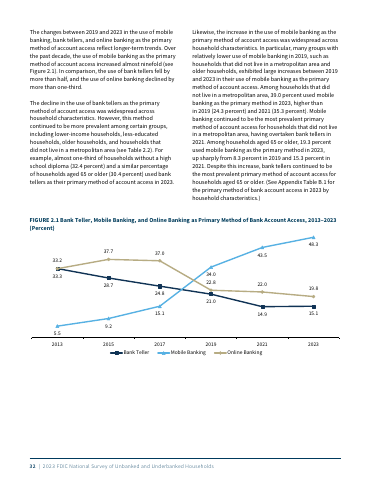
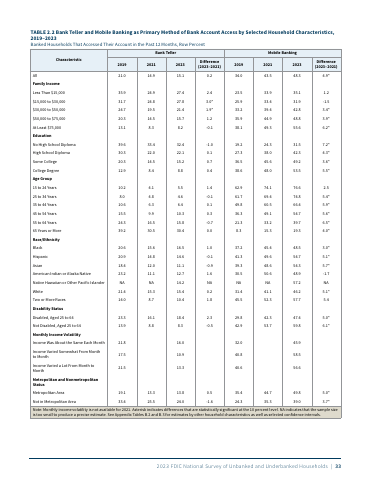
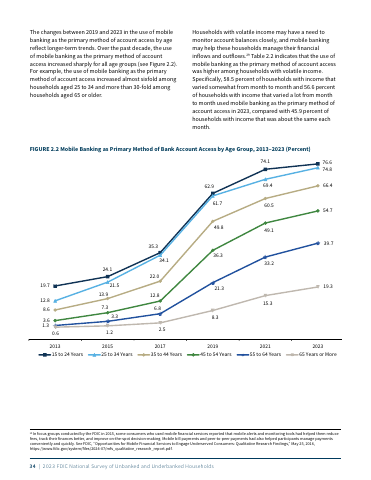
- Mobile banking was used by 48.3 percent of banked households as their primary method of bank account access in 2023.p.16
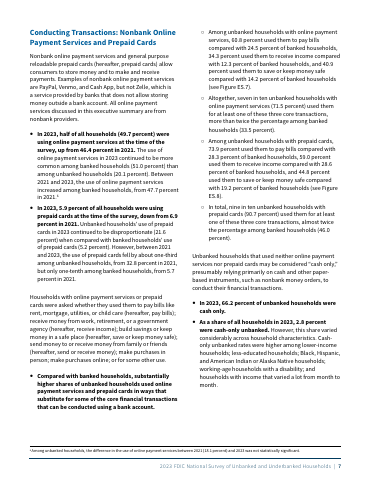
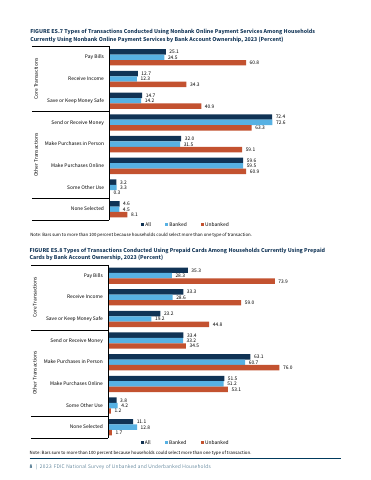
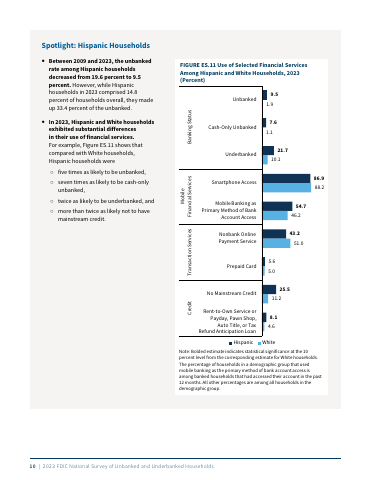
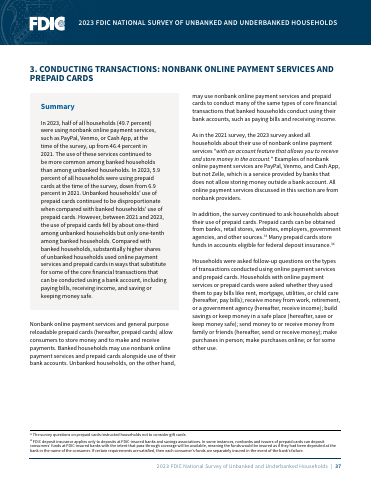
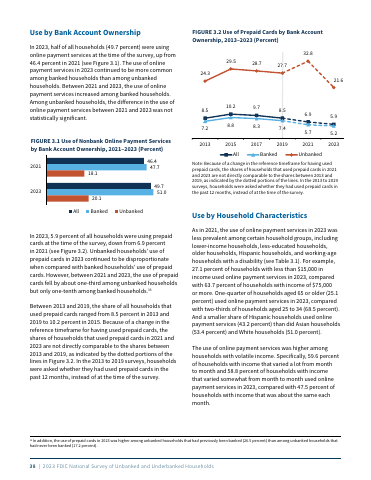
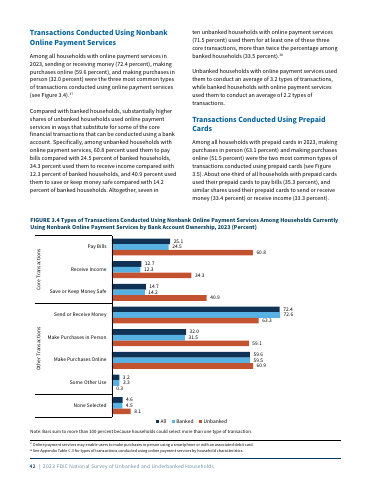
- Half of all households (49.7 percent) were using nonbank online payment services like PayPal, Venmo, or Cash App in 2023.p.19
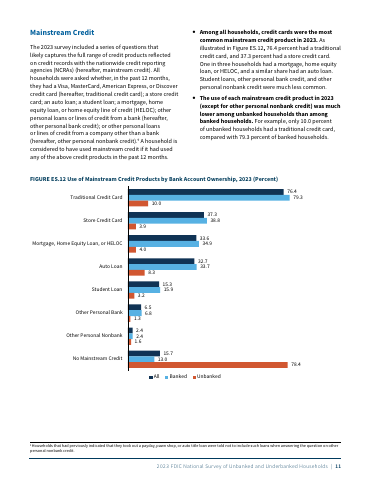
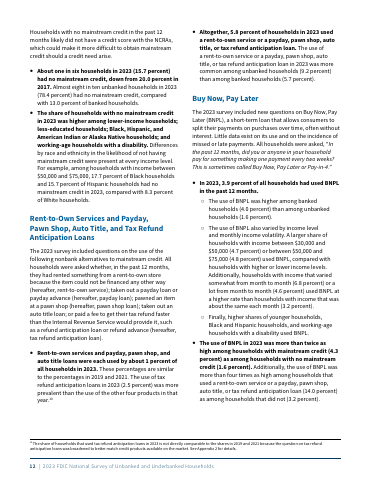
- About one in six U.S. households (15.7 percent) had no mainstream credit in 2023, down from 20.0 percent in 2017.p.24
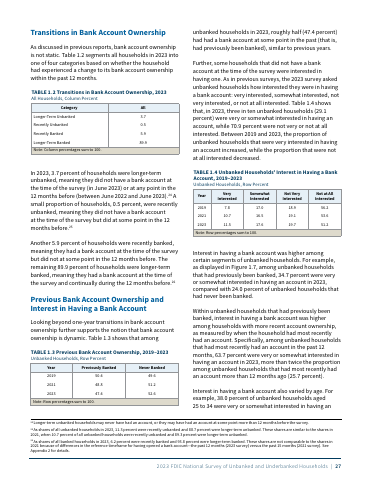
- In 2023, 14.2 percent of U.S. households, representing about 19.0 million households, were underbanked.p.27
Key insights
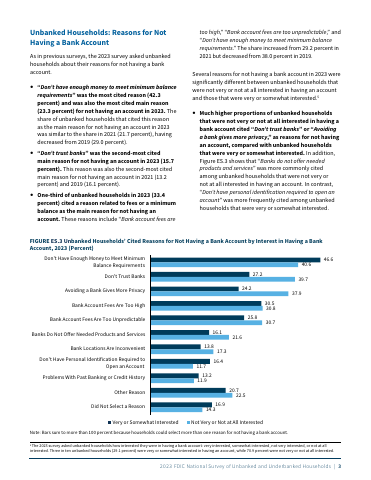
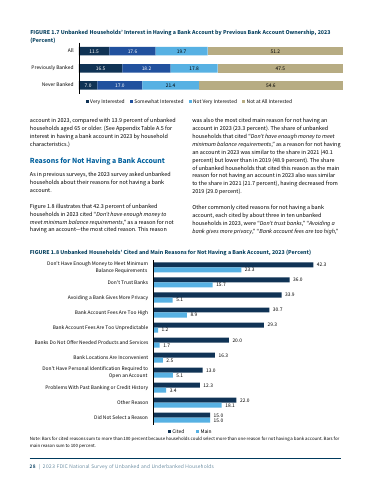
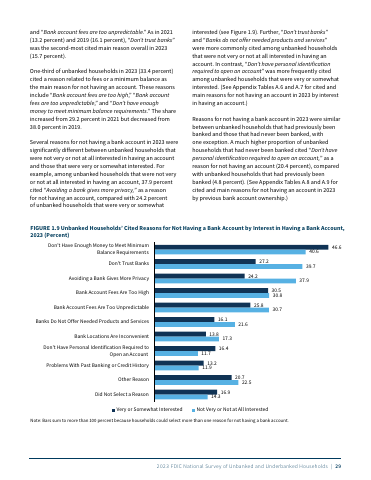
- Not having enough money to meet minimum balance requirements was the most cited main reason for being unbanked in 2023 at 23.3 percent.p.15
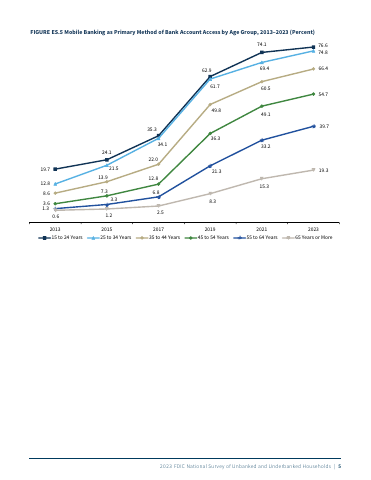
- Use of mobile banking as the primary account access method increased almost ninefold over the past decade.p.16
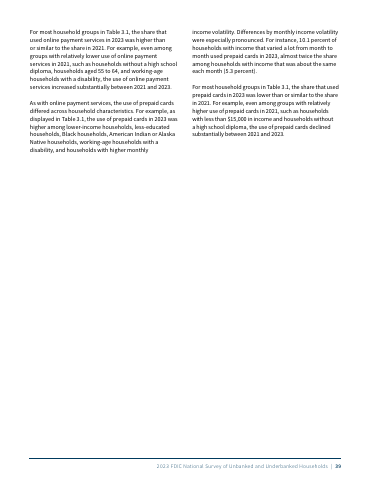
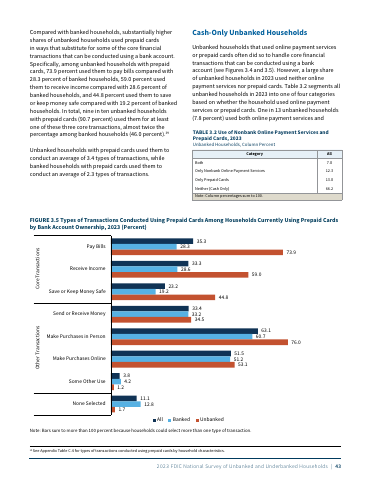
- Use of prepaid cards among unbanked households dropped by about one-third between 2021 and 2023, falling to 21.6 percent.p.19
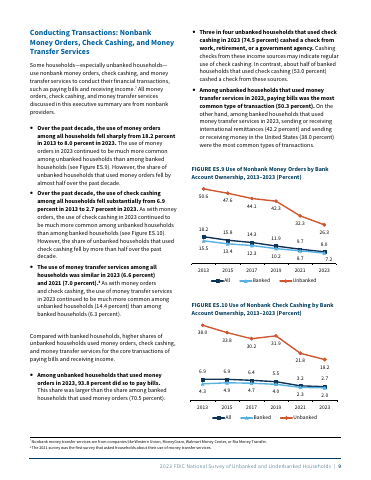
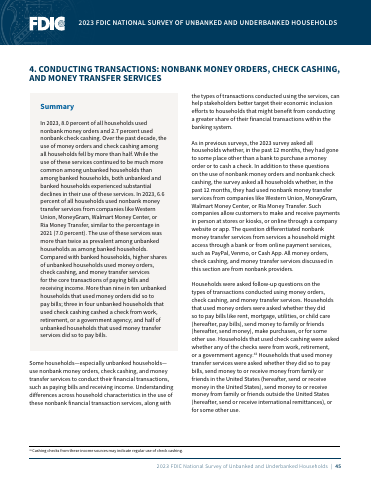
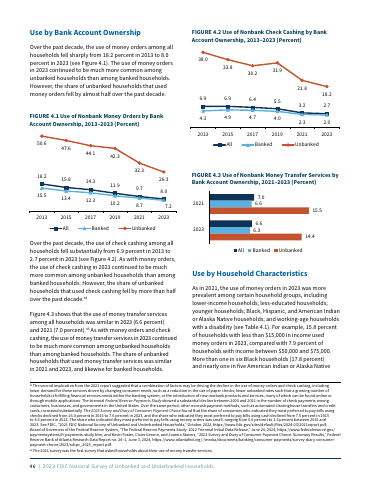
- Use of nonbank money orders among all households declined from 18.2 percent in 2013 to 8.0 percent in 2023.p.21
- Nonbank check cashing use fell by more than half over the past decade, reaching 2.7 percent of all households in 2023.p.21
Pages
 p.1
 p.2
 p.3
 p.4
 p.5
 p.6
 p.7
 p.8
 p.9
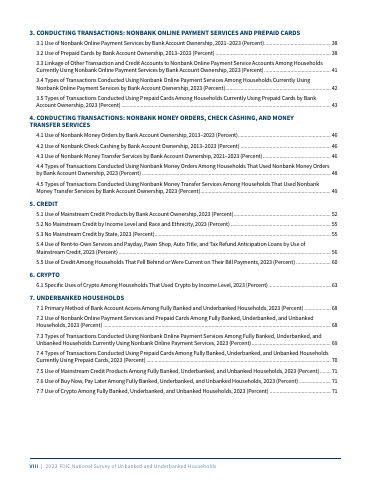 p.10
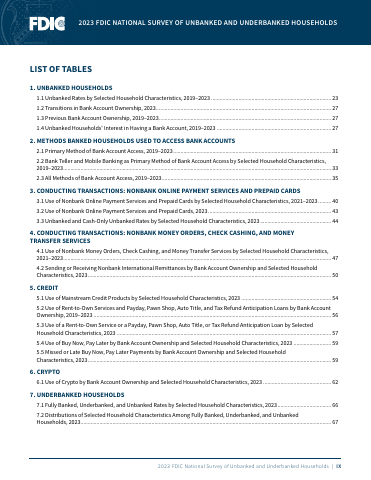 p.11
 p.12
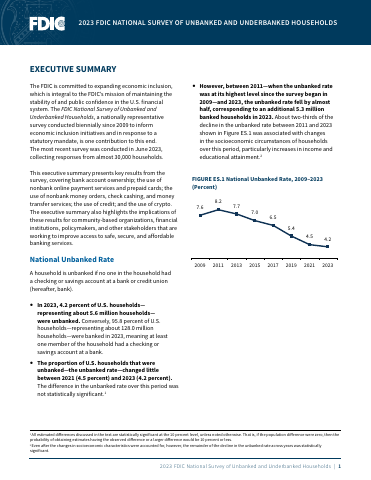 p.13
 p.14
 p.15
 p.16
 p.17
 p.18
 p.19
 p.20
 p.21
 p.22
 p.23
 p.24
 p.25
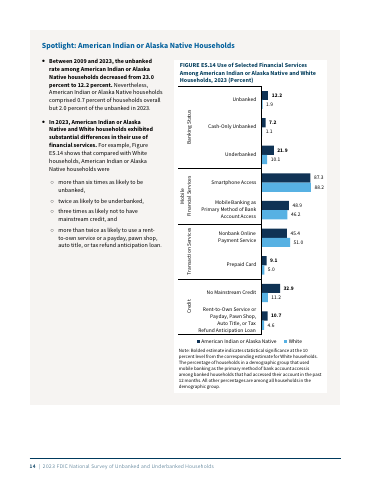 p.26
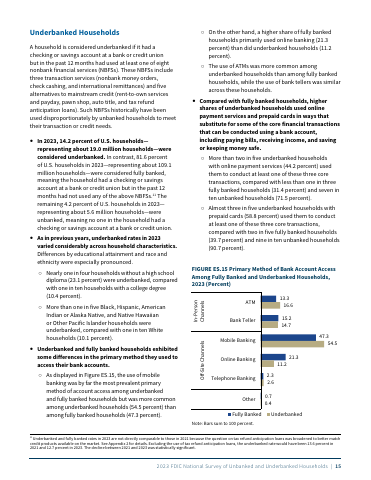 p.27
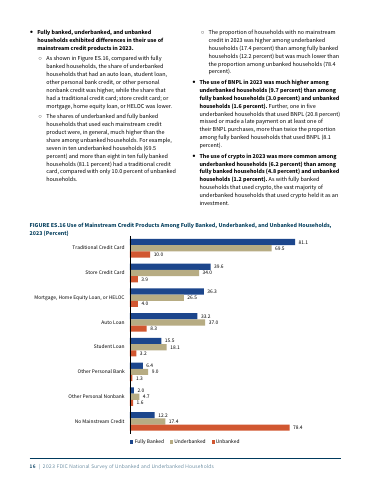 p.28
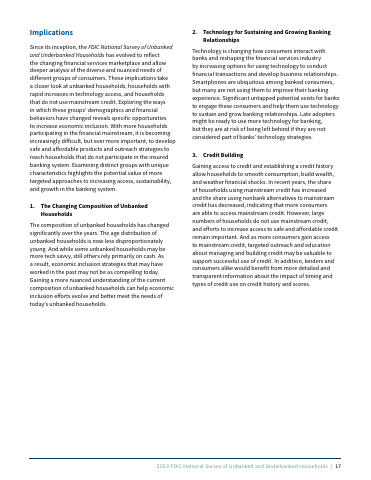 p.29
 p.30
 p.31
 p.32
 p.33
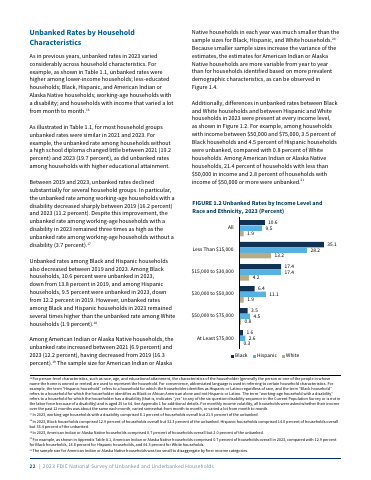 p.34
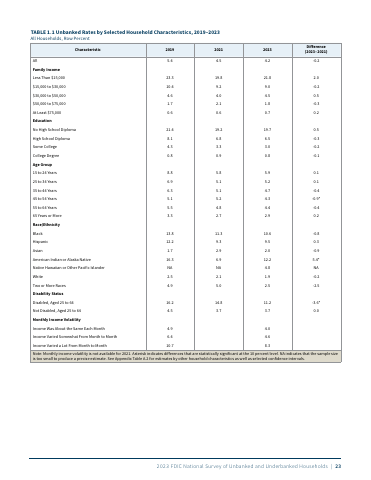 p.35
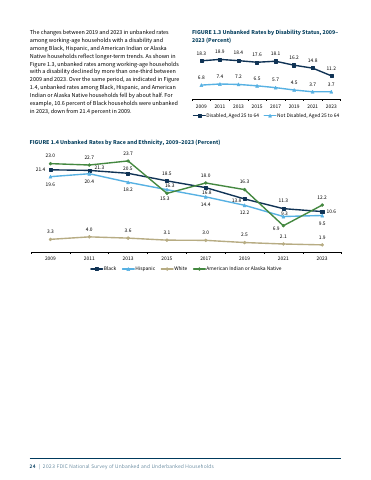 p.36
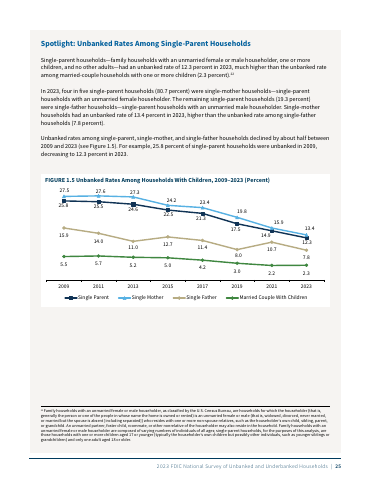 p.37
 p.38
 p.39
 p.40
 p.41
 p.42
 p.43
 p.44
 p.45
 p.46
 p.47
 p.48
 p.49
 p.50
 p.51
 p.52
 p.53
 p.54
 p.55
 p.56
 p.57
 p.58
 p.59
 p.60
Topics and entities
Summary and figures generated from the document and checked automatically: every number shown appears on the cited page. Publishers can request removal.