2023 FDIC National Survey of Unbanked and Underbanked Households - Executive Summary (FDIC)
Summary
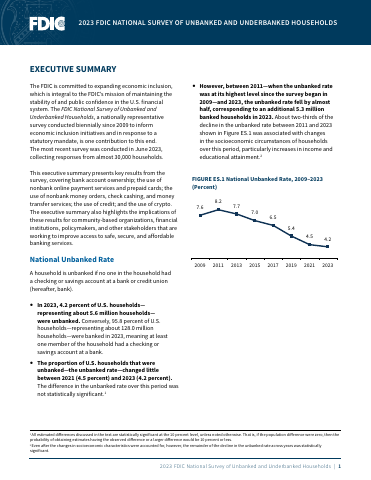
- In 2023, 4.2 percent of U.S. households—representing about 5.6 million households—were unbanked.p.5
- Between 2011 and 2023, the national unbanked rate fell by almost half, corresponding to an additional 5.3 million banked households in 2023.p.5
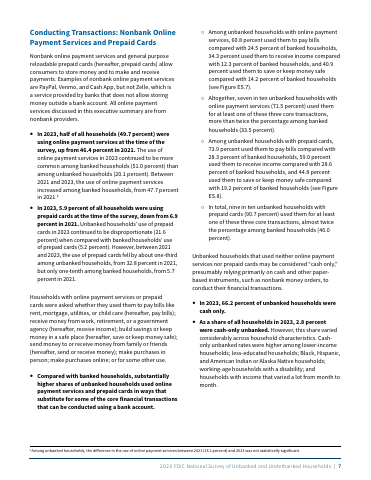
- Half of all households (49.7 percent) used nonbank online payment services in 2023, up from 46.4 percent in 2021.p.11
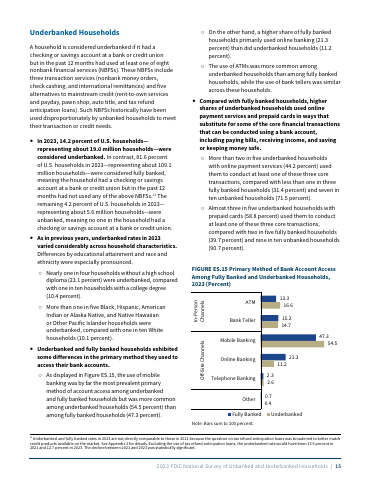
- In 2023, 14.2 percent of U.S. households—representing about 19.0 million households—were considered underbanked.p.19
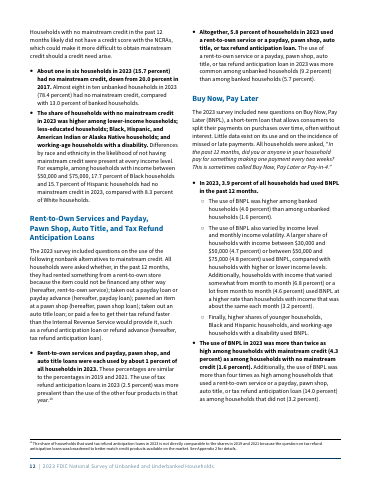
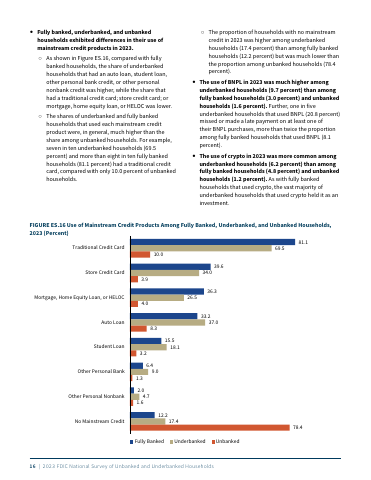
- In 2023, 3.9 percent of all households had used Buy Now, Pay Later (BNPL) in the past 12 months.p.16
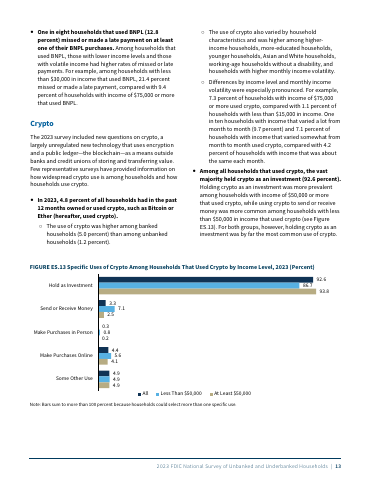
- In 2023, 4.8 percent of all households had owned or used crypto in the past 12 months.p.17
Key insights
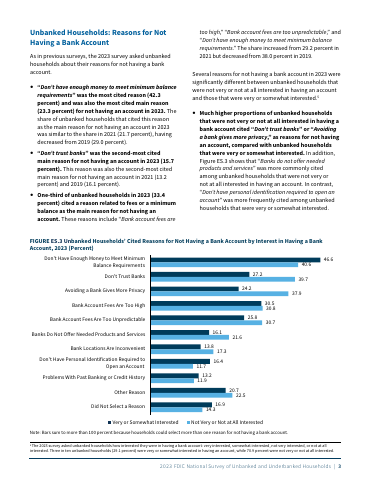
- 'Don't have enough money to meet minimum balance requirements' was the most cited main reason for not having a bank account in 2023, selected by 23.3 percent of unbanked households.p.7
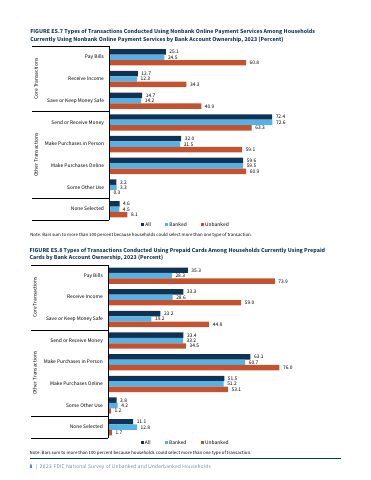
- Seven in ten unbanked households using nonbank online payment services (71.5 percent) used them for core financial transactions such as paying bills, receiving income, or saving money.p.11
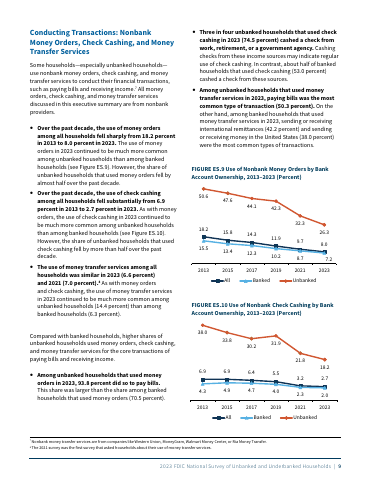
- The use of nonbank money orders among all households fell from 18.2 percent in 2013 to 8.0 percent in 2023.p.13
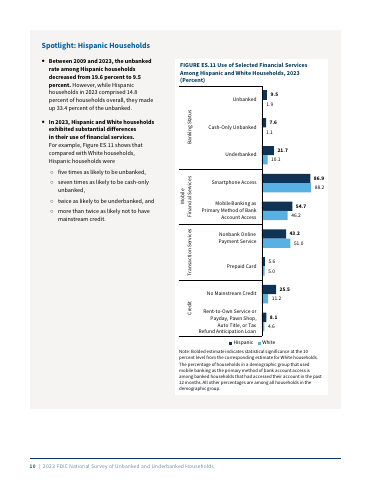
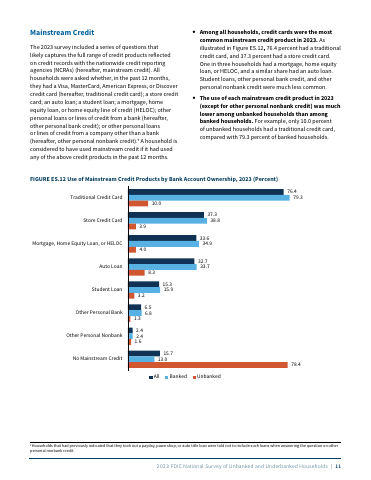
- About one in six U.S. households (15.7 percent) had no mainstream credit in 2023, down from 20.0 percent in 2017.p.16
- The vast majority of households that used crypto in 2023 held it as an investment (92.6 percent).p.17
Pages
 p.1
 p.2
 p.3
 p.4
 p.5
 p.6
 p.7
 p.8
 p.9
 p.10
 p.11
 p.12
 p.13
 p.14
 p.15
 p.16
 p.17
 p.18
 p.19
 p.20
 p.21
 p.22
 p.23
 p.24
Topics and entities
Summary and figures generated from the document and checked automatically: every number shown appears on the cited page. Publishers can request removal.