Time between Seed and Series A hit a new high in Q4
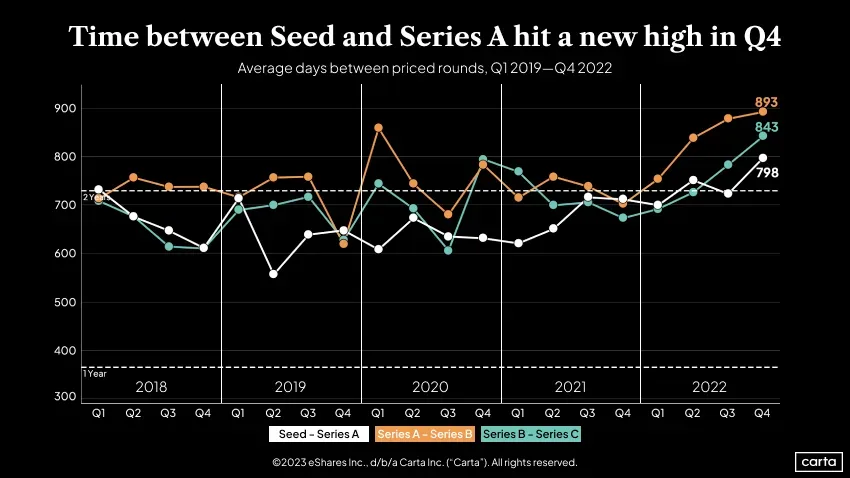
Chart showing the average days between priced venture capital rounds from Q1 2018 through Q4 2022, highlighting significant increases in time between rounds in late 2022.
| Label | Value shown on the chart |
|---|---|
| Series A - Series B (Q4 2022) | 893 |
| Series B - Series C (Q4 2022) | 843 |
| Seed - Series A (Q4 2022) | 798 |
Shown as a preview with credit and a link to the original. Publishers can request removal.
View the original on carta.com