Funding distribution by stage in Q3 mirrors the mix observed in 2024
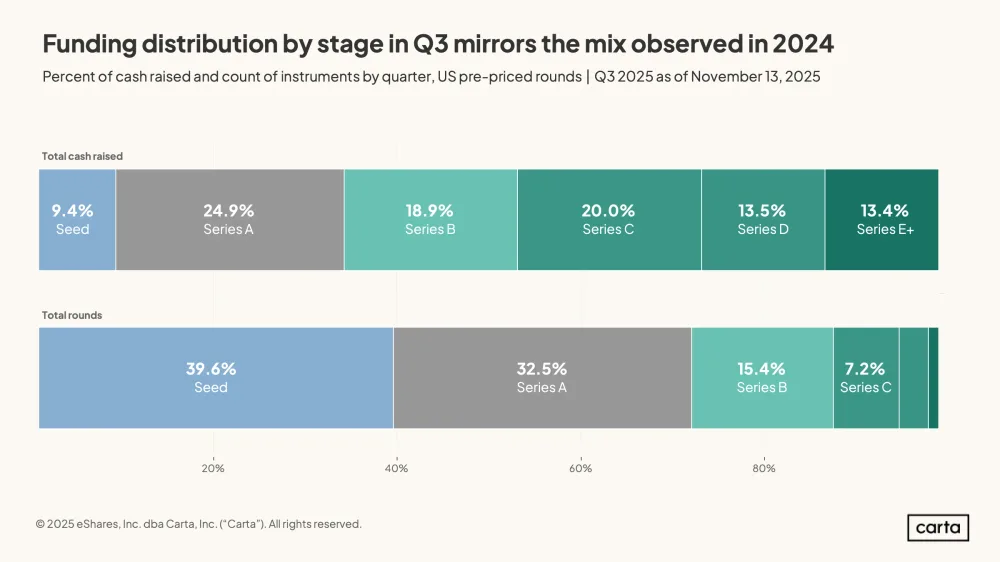
Percent of cash raised and count of instruments by quarter for US pre-priced rounds in Q3 2025. Seed rounds accounted for 9.4% of total cash raised but 39.6% of total rounds, while Series A represented 24.9% of cash raised and 32.5% of total rounds.
| Label | Value shown on the chart |
|---|---|
| Total cash raised - Seed | 9.4% |
| Total cash raised - Series A | 24.9% |
| Total cash raised - Series B | 18.9% |
| Total cash raised - Series C | 20.0% |
| Total cash raised - Series D | 13.5% |
| Total cash raised - Series E+ | 13.4% |
| Total rounds - Seed | 39.6% |
| Total rounds - Series A | 32.5% |
| Total rounds - Series B | 15.4% |
| Total rounds - Series C | 7.2% |
Shown as a preview with credit and a link to the original. Publishers can request removal.
View the original on carta.com