Concentration of VC: investment is up 157% on 8% fewer rounds since 2023
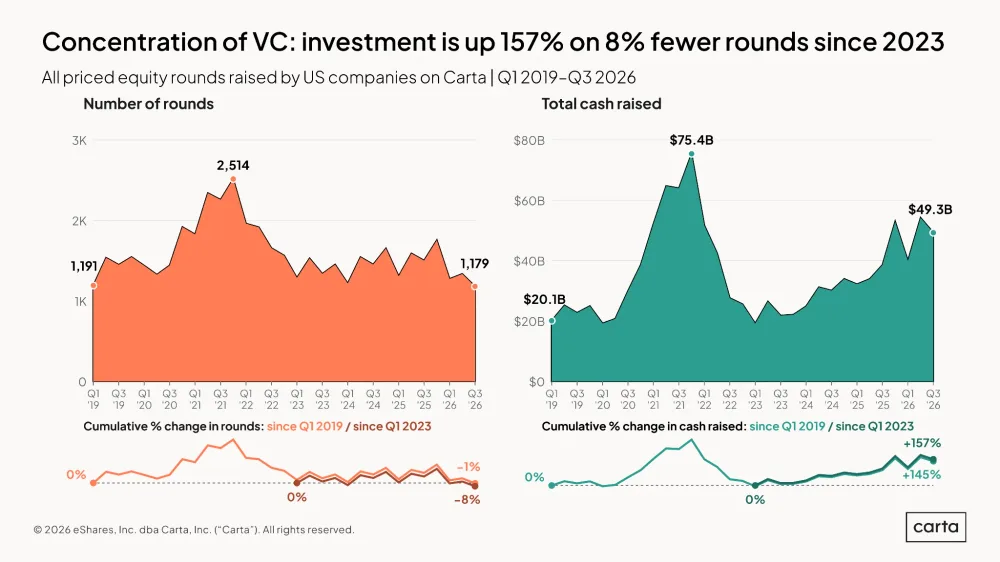
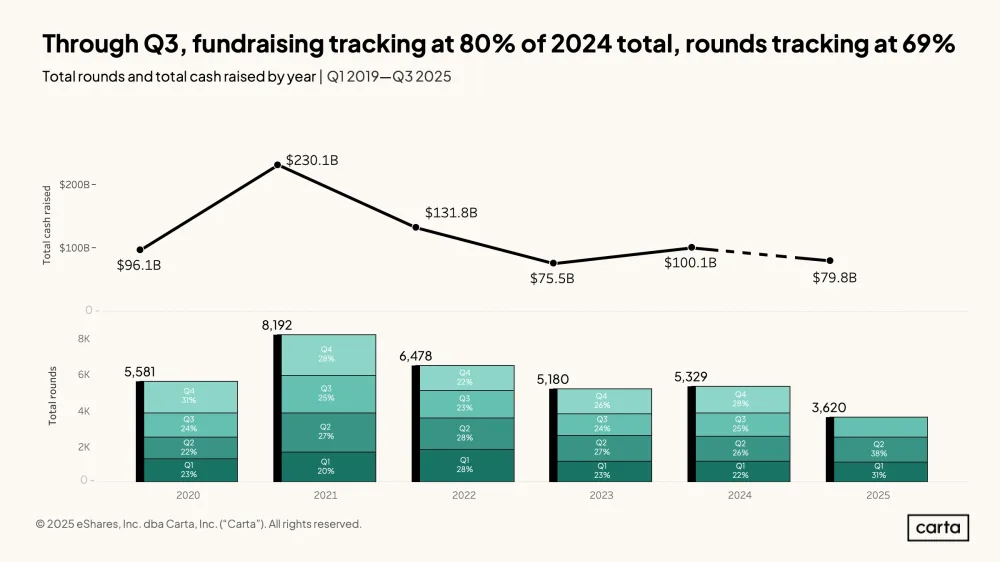
This chart tracks priced equity rounds and total cash raised by US companies on Carta from Q1 2019 through Q3 2026. It highlights that while deal count has slightly declined since 2023, the amount of cash raised has surged dramatically.
| Label | Value shown on the chart |
|---|---|
| Q1 '19 Number of rounds | 1,191 |
| Peak Number of rounds | 2,514 |
| Q3 '26 Number of rounds | 1,179 |
| Q1 '19 Cash raised | $20.1B |
| Peak Cash raised | $75.4B |
| Q3 '26 Cash raised | $49.3B |
| Cumulative % change in rounds since Q1 2019 | -1% |
| Cumulative % change in rounds since Q1 2023 | -8% |
| Cumulative % change in cash raised since Q1 2019 | +145% |
| Cumulative % change in cash raised since Q1 2023 | +157% |
Shown as a preview with credit and a link to the original. Publishers can request removal.
View the original on carta.com