Fewest Series D deals since Q3 2018
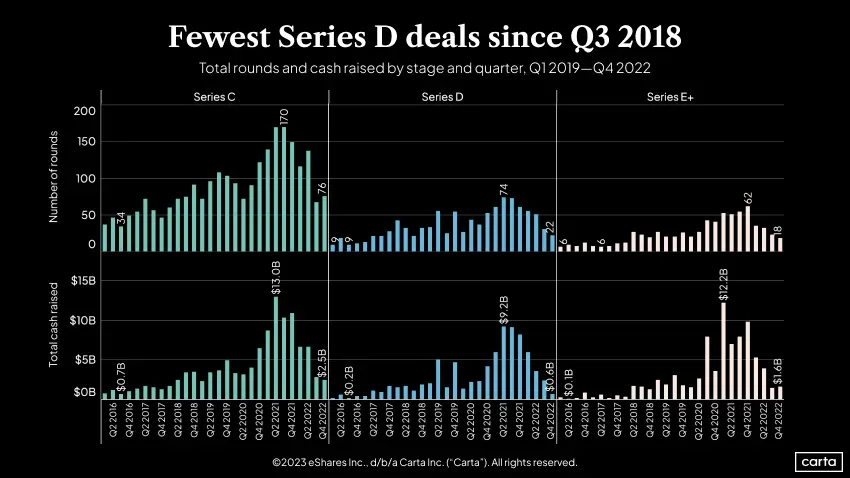
This chart shows the total number of funding rounds and total cash raised by stage (Series C, Series D, Series E+) per quarter from Q1 2016 to Q4 2022. It highlights a sharp decline in venture funding deals and amount raised across late-stage startups in 2022.
| Label | Value shown on the chart |
|---|---|
| Series C Peak Rounds (Q2 2021) | 170 |
| Series C Q4 2022 Rounds | 76 |
| Series C Peak Cash (Q2 2021) | $13.0B |
| Series C Q4 2022 Cash | $2.5B |
| Series D Peak Rounds (Q2 2021) | 74 |
| Series D Q4 2022 Rounds | 22 |
| Series D Peak Cash (Q2 2021) | $9.2B |
| Series D Q4 2022 Cash | $0.6B |
| Series E+ Peak Rounds (Q4 2021) | 62 |
| Series E+ Q4 2022 Rounds | 18 |
| Series E+ Peak Cash (Q1 2021) | $12.2B |
| Series E+ Q4 2022 Cash | $1.6B |
Shown as a preview with credit and a link to the original. Publishers can request removal.
View the original on carta.com