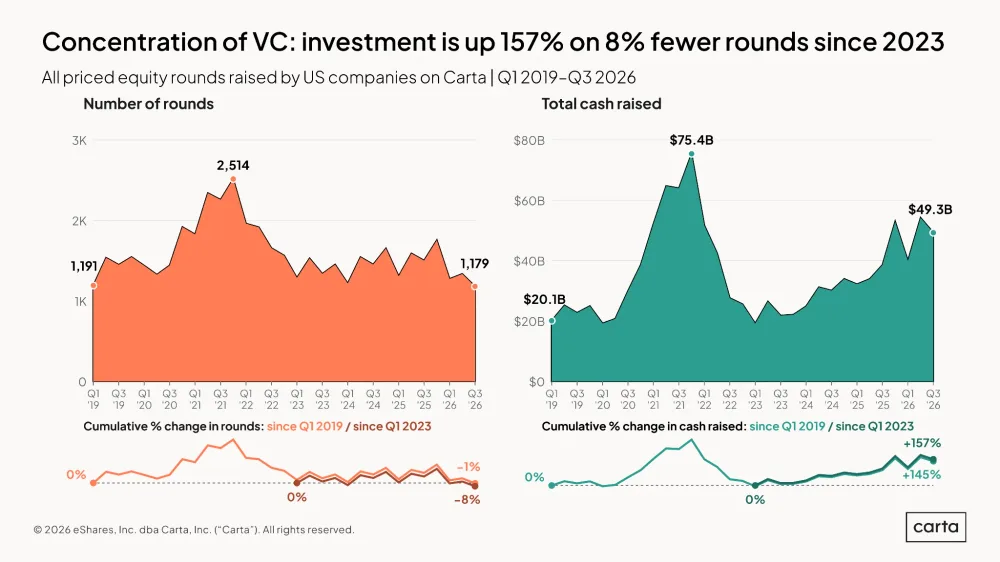
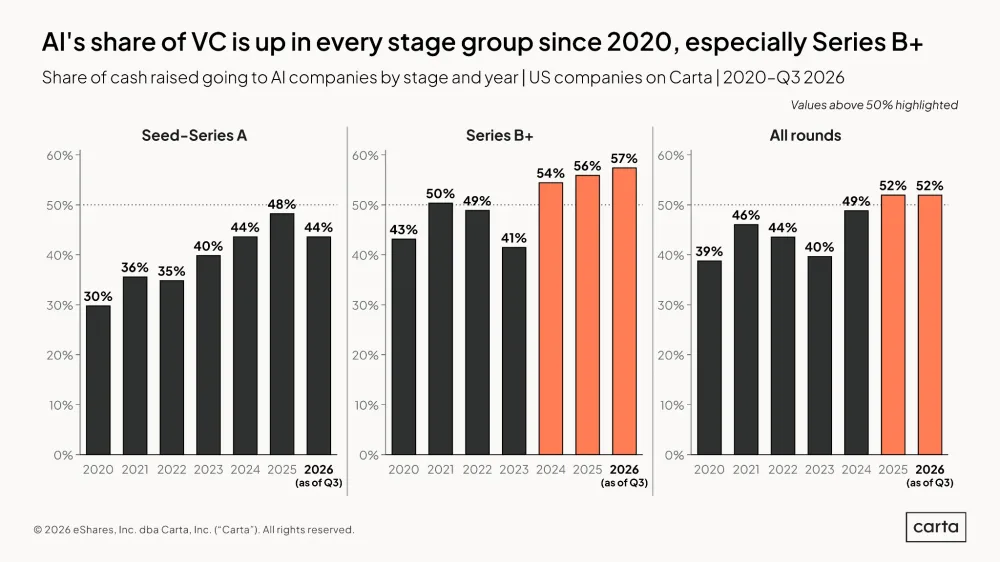
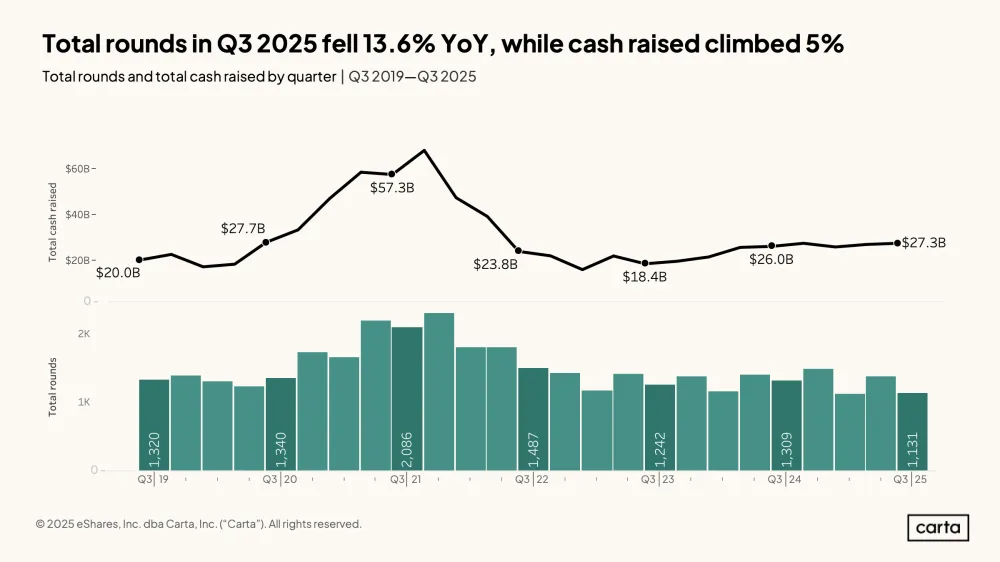
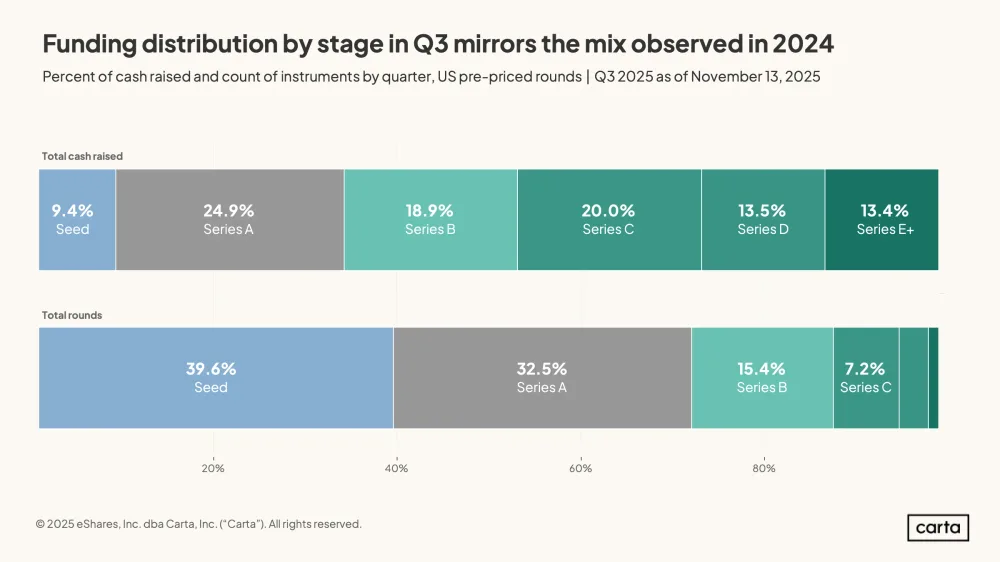
Through Q3, fundraising tracking at 80% of 2024 total, rounds tracking at 69%
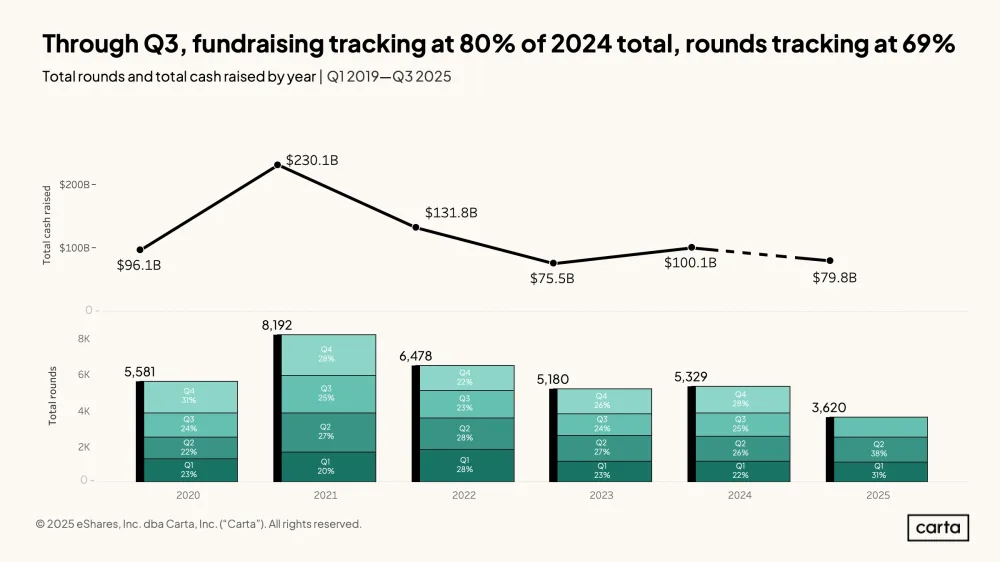
This chart tracks total cash raised and total startup investment rounds by year from 2020 through Q3 2025. Cash raised peaked in 2021 at $230.1B across 8,192 rounds before settling around $100.1B in 2024.
| Label | Value shown on the chart |
|---|---|
| 2020 Cash Raised | $96.1B |
| 2020 Total Rounds | 5,581 |
| 2021 Cash Raised | $230.1B |
| 2021 Total Rounds | 8,192 |
| 2022 Cash Raised | $131.8B |
| 2022 Total Rounds | 6,478 |
| 2023 Cash Raised | $75.5B |
| 2023 Total Rounds | 5,180 |
| 2024 Cash Raised | $100.1B |
| 2024 Total Rounds | 5,329 |
| 2025 Cash Raised | $79.8B |
| 2025 Total Rounds | 3,620 |
Shown as a preview with credit and a link to the original. Publishers can request removal.
View the original on carta.com