The median Q4 Series A raised 35% less than in Q1
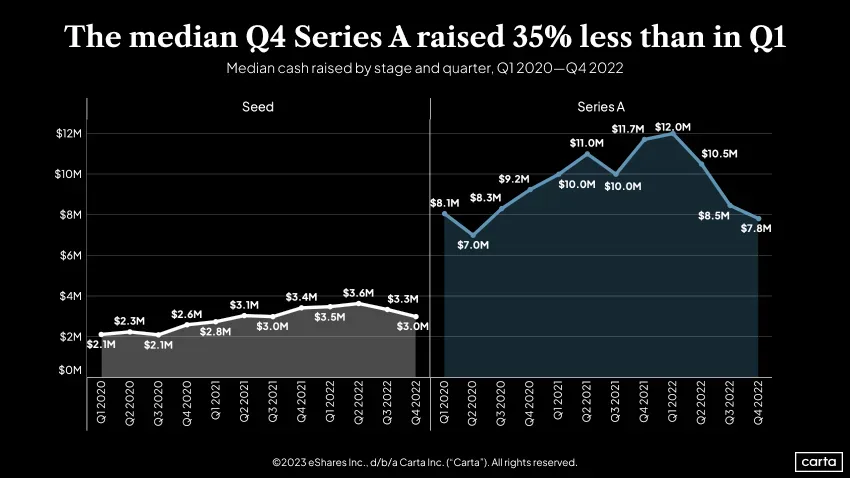
This area chart shows the median cash raised by stage (Seed and Series A) per quarter from Q1 2020 to Q4 2022. Series A median deal sizes peaked in Q1 2022 at $12.0M before declining to $7.8M by Q4 2022.
| Label | Value shown on the chart |
|---|---|
| Series A Q1 2020 | $8.1M |
| Series A Q2 2020 | $7.0M |
| Series A Q3 2020 | $8.3M |
| Series A Q4 2020 | $9.2M |
| Series A Q1 2021 | $10.0M |
| Series A Q2 2021 | $11.0M |
| Series A Q3 2021 | $10.0M |
| Series A Q4 2021 | $11.7M |
| Series A Q1 2022 | $12.0M |
| Series A Q2 2022 | $10.5M |
| Series A Q3 2022 | $8.5M |
| Series A Q4 2022 | $7.8M |
Shown as a preview with credit and a link to the original. Publishers can request removal.
View the original on carta.com