Bridge rounds took a greater share of all rounds across stages
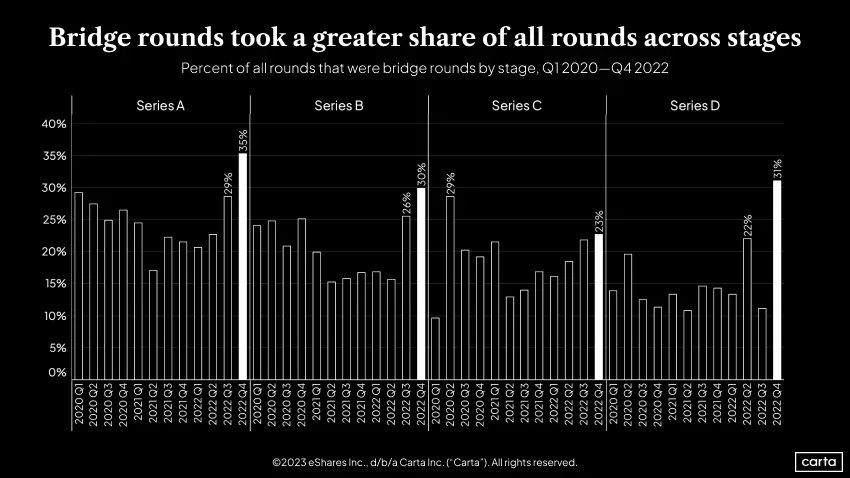
This chart shows the percentage of all funding rounds that were bridge rounds across Series A, B, C, and D from Q1 2020 through Q4 2022. The share of bridge rounds rose significantly by Q4 2022 across all stages, reaching 35% in Series A and 31% in Series D.
| Label | Value shown on the chart |
|---|---|
| Series A 2022 Q3 | 29% |
| Series A 2022 Q4 | 35% |
| Series B 2022 Q3 | 26% |
| Series B 2022 Q4 | 30% |
| Series C 2020 Q2 | 29% |
| Series C 2022 Q4 | 23% |
| Series D 2022 Q2 | 22% |
| Series D 2022 Q4 | 31% |
Shown as a preview with credit and a link to the original. Publishers can request removal.
View the original on carta.com